Data Visualization Dashboard
Download free data visualization dashboard design
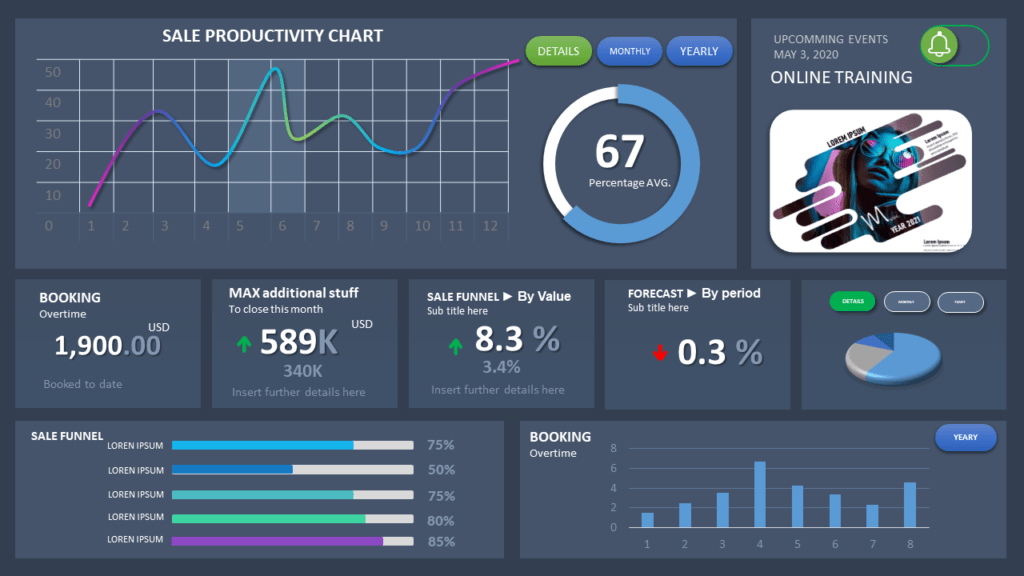
A data visualization dashboard design is a type of graphical user interface that often provides at-a-glance views of key performance indicators (KPIs) relevant to a particular objective or business process. In another usage, “dashboard” is another name for “progress report” or “report” and is considered a form of data visualization.
The template is designed in PowerPoint and you are free to use it personnel use.
in case you want to learn how to make your own data virtualization dashboard template Visit the YouTube channel
© 2022 All rights reserved
Made with ❤ with Elementor