
A profitable business can still struggle to pay its bills when customers pay late. Sales may look healthy, but payroll, rent, and supplier payments need cash available on specific dates.
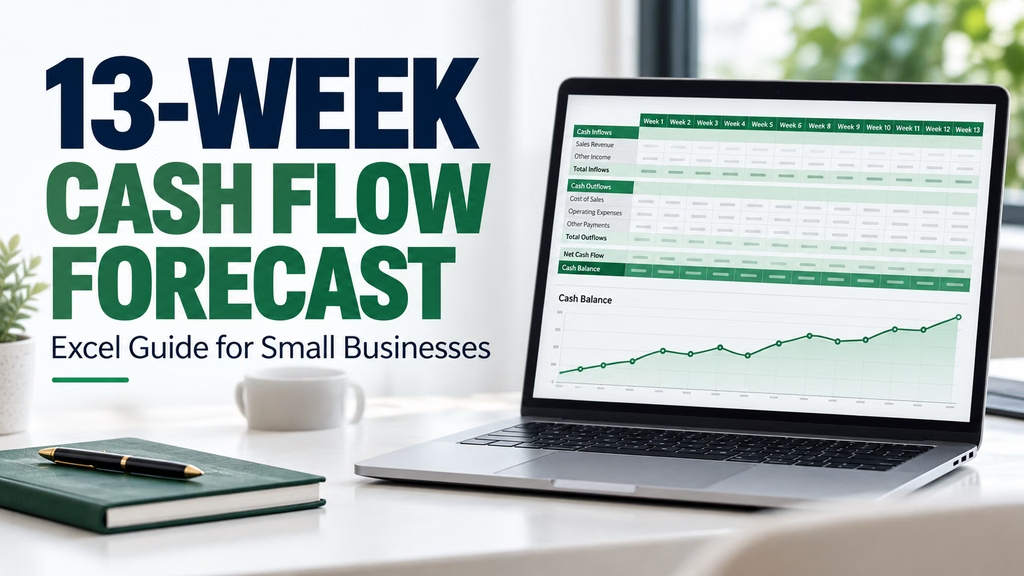
A 13-week cash flow forecast in Excel helps you estimate your bank balance week by week. It shows when money is expected to arrive, when payments are due, and which weeks may need attention.
This guide explains how to build a simple forecast, add the formulas, and test what happens when a customer pays two weeks late. The example uses US dollars, but you can use the same structure with pounds, Canadian dollars, Australian dollars, or another currency.
What Is a 13-Week Cash Flow Forecast in Excel?
A 13-week cash flow forecast estimates cash receipts and payments over thirteen consecutive weeks. You update it regularly to maintain a view of the next thirteen weeks.
Its basic calculation is:
Opening cash + Cash received − Cash paid = Closing cash
The closing balance of one week becomes the opening balance of the next.
Unlike a profit forecast, a cash forecast follows the timing of actual money movements. An invoice issued this week belongs in the week you expect the customer to pay, rather than automatically appearing as cash this week.
What You Need Before Starting
Gather the following information:
- Your available business bank balance.
- Unpaid customer invoices and expected collection dates.
- Expected cash sales and customer deposits.
- Supplier invoices and payment dates.
- Payroll, rent, subscriptions, and other scheduled payments.
- Loan repayments and planned equipment purchases.
- Tax payments expected during the forecast period.
Use one currency throughout the workbook. If your business has multiple currencies, convert the amounts using clearly documented exchange-rate assumptions before combining them.
Avoid counting transfers between your own included bank accounts as new income or expenses.
Download the Free 13-Week Cash Flow Forecast Excel Template
Follow this guide using our free Excel template. It includes a blank forecast, a completed example, automatic cash-balance calculations, and a chart comparing closing cash with your minimum cash target.
The worked example lets you delay a customer payment by two weeks and see how it affects available cash.
Download the Free Excel Template
Step 1: Set Up the Weekly Columns
Open a blank Excel workbook and rename the worksheet Cash Forecast.
Use column A for descriptions and columns B through N for the thirteen weeks.
In B2, enter the start date of your first week. Choose a consistent day, such as Monday.
In C2, enter:
=B2+7
Drag the formula across to N2. Format these cells as dates.
Each column now represents a seven-day period beginning on the date shown.
Step 2: Add the Cash Flow Categories
Enter these labels in column A:
| Row | Label |
|---|---|
| 4 | Opening cash balance |
| 6 | Customer invoice collections |
| 7 | Cash sales and customer deposits |
| 8 | Other cash receipts |
| 9 | Total cash receipts |
| 11 | Payroll |
| 12 | Rent and utilities |
| 13 | Supplier payments |
| 14 | Taxes paid |
| 15 | Loan payments |
| 16 | Other cash payments |
| 17 | Total cash payments |
| 19 | Net cash movement |
| 20 | Closing cash balance |
| 21 | Minimum cash target |
| 22 | Cash above or below target |
Rename the categories to suit your business. For example, a digital agency might track contractor payments separately, while a retailer might need an inventory category.
Enter receipts and payments as positive numbers. The formulas will subtract payments from receipts.
Step 3: Enter Your Opening Cash Balance
Enter your available opening cash in B4.
For this example, use:
$5,000
The balance should relate to the beginning of the first forecast week. If some funds are restricted and unavailable for ordinary bills, keep them separate from available operating cash.
Do not add an unused credit facility to your bank balance. If you expect to draw on it, show that drawdown separately as a financing receipt.
Step 4: Add the Excel Formulas
Enter the following formulas in column B:
| Cell | Formula | Purpose |
|---|---|---|
| B9 | =SUM(B6:B8) | Total receipts |
| B17 | =SUM(B11:B16) | Total payments |
| B19 | =B9-B17 | Net cash movement |
| B20 | =B4+B19 | Closing cash |
| B22 | =B20-B21 | Cash compared with your target |
Copy these formula cells across to column N.
Next, enter this formula in C4:
=B20
Copy it across to N4. Each week’s opening balance will now use the previous week’s closing balance.
In B21, enter a minimum cash target. For this example, use $2,000, then copy that amount across the thirteen weeks.
This target is an illustrative planning assumption, not a recommended reserve for every business. Choose a target that reflects your payment commitments and uncertainty.
Step 5: Schedule Receipts and Payments
Enter each amount in the week when you expect the cash to move.
For customer collections, consider payment history as well as invoice due dates. If a customer regularly pays late, an optimistic collection date can make the forecast misleading.
For expenses, use scheduled payment dates where available. Record payroll in the weeks employees are paid and rent in the week it leaves the account.
Include cash payments that may not appear as ordinary operating expenses in a profit report, such as loan principal repayments and equipment purchases.
Keep tax amounts consistent with the cash you expect to receive and pay. Avoid recording the same payment in two categories.
A Worked Example: What Happens When a Customer Pays Late?
Assume your first week has these forecast amounts:
| Item | Amount |
|---|---|
| Opening cash | $5,000 |
| Customer invoice collections | $3,000 |
| Payroll | $1,800 |
| Rent and utilities | $1,200 |
| Supplier payments | $900 |
| Other cash payments | $600 |
| Total cash payments | $4,500 |
The expected closing balance is:
$5,000 + $3,000 − $4,500 = $3,500
With a minimum cash target of $2,000, the business finishes the week $1,500 above its target.
Now assume the customer pays two weeks later.
Move the $3,000 collection from Week 1 to Week 3. Do not add another receipt while leaving the original amount in place.
Week 1’s revised closing balance becomes:
$5,000 + $0 − $4,500 = $500
The business is now $1,500 below its minimum cash target.
The sale has not disappeared, but its timing has changed. That timing difference can affect whether the business has enough cash for its next payments.
Review the later weeks too. A delayed receipt changes every subsequent opening balance until the payment arrives.
Step 6: Highlight Weeks That Need Attention
Add a warning to the closing cash balances:
- Select B20.
- Go to Home → Conditional Formatting → New Rule.
- Choose Use a formula to determine which cells to format.
- Enter
=B20<B21. - Select a light red fill and save the rule.
Excel will highlight weeks when closing cash falls below the corresponding target.
You can also add a line chart using the week dates and closing cash balances. Include the minimum cash target as a second series so you can see the gap.
Step 7: Update the Forecast Every Week
A forecast becomes less useful when its assumptions are left unchanged.
At the end of each week:
- Compare forecast receipts and payments with actual bank movements.
- Investigate significant differences.
- Update collection dates for unpaid invoices.
- Add newly confirmed payments.
- Reconcile the next opening balance to available cash.
- Extend the forecast to maintain thirteen future weeks.
Save a dated copy before updating. This lets you compare earlier forecasts with actual results and learn where your estimates need improvement.
Check the formulas after moving columns or extending the period.
Common Cash Forecasting Mistakes
Treating invoiced sales as cash received
A customer invoice is not available cash until it is collected. Forecast the expected payment date.
Omitting irregular payments
Annual insurance, tax payments, equipment purchases, and loan repayments can create cash pressure even when routine expenses are stable.
Counting receipts twice
Avoid counting a deposit again as part of the final invoice collection. Record only the remaining amount still due.
Assuming late payments will arrive on time
Use realistic dates and test a delayed-payment scenario for important customers.
Confusing closing cash with profit
A cash balance measures available money. It does not replace a profit and loss statement or explain the profitability of the business.
Frequently Asked Questions
Why use thirteen weeks?
Thirteen weeks provides roughly a quarter of weekly visibility. It can help you see near-term payment pressure without relying only on monthly totals.
Can a small business use this forecast?
Yes. The structure can be adapted for freelancers, agencies, shops, and other businesses. Use categories that match your actual receipts and payments.
Can I use it in another currency?
Yes. Change the number format and currency label. Changing the symbol does not convert amounts, so enter all figures in the same currency.
What if the forecast shows a negative balance?
First check the opening cash, formulas, and payment dates. If the shortfall is realistic, review collection options, discretionary spending, and financing arrangements before the affected week.
Is this the same as a cash flow statement?
This forecast estimates future cash movements. A historical cash flow statement reports cash movements that have already occurred. A simple planning workbook also differs from a formal financial-reporting statement.
Start With Realistic Dates
A useful 13-week cash flow forecast does more than total income and expenses. It puts receipts and payments in the weeks when they are likely to happen.
Start with a simple workbook, check its calculations, and update it regularly. The aim is to spot cash pressure early enough to make an informed decision.
For additional guidance, see the Australian Government’s explanation of setting up a cash flow statement and using it for forecasting.
The figures in this guide are hypothetical and illustrate how the workbook works.